Publication

Budgeting for Build-Outs – Savills Legal Tenant Profiles Rise in Construction Costs from 2017 -2019

Image treatment
Analyzing Total Construction Costs

In the last two years, the cost of building out a typical, Class-A law firm space around the world has grown by 10% overall with a wide range seen when compared city by city. Working with Savills construction management team, the Savills Legal Tenant Practice Group has gathered, reviewed, and compared typical law firm construction budgets from 19 global markets,11 domestic and 8 international.

Since Savills last analyzed costs in these markets at the end of 2017, U.S. markets saw an average increase of 12.0%, with an 8.0% increase abroad. Cities that are seeing the highest growth in costs include Tokyo (33.0% increase), San Francisco (27.0% increase) and Chicago (22.0% increase). The only market to see costs decline in this period was Toronto, where costs dipped by 6.0%.
Image treatment

For each market we examined, we’ve provided a construction budget typical for a 25,000-sf, top-ranking law firm that would be building out new, class-A-quality, space. These budgets include all cost categories in addition to the actual construction, from architect and engineer fees, to moving costs, furniture and equipment, and technology. Please note that these costs represent a single data point for each market to show relative costs. One can expect wide variations from this number based on design, materials, schedule, and individual decisions made for each project.

As far as overall cost, Paris tops the list, surpassing $400.00 per square foot (psf) for total build-out, with Brussels close behind ($398.75 psf). Domestically, and as one would expect, both San Francisco and New York City rank the highest with total costs of $384.00 psf and $354.28 psf, respectively. Boston and Washington, D.C. are close behind at $282.00 psf and $274.40 psf. APAC markets, particularly Hong Kong and Shanghai/Beijing are the least expensive with total costs under $200.00 psf.

A Look at Cost Breakdown

So what makes one market more expensive than another? Is it simply that goods and services in top-tier markets cost more? Or are there greater variations within the cost component breakdown?

Image treatment

The chart above shows all cost components as a relative percentage of a market’s total construction cost (seen in our first chart). The different colored sections in each bar represent a different cost component as outlined in the legend.

When all markets are considered, each cost category has an average as outlined below:


Architecture

Engineering

Other Consultants

Permits & Fees

Project Management

Construction Costs

Technology

Furniture / Equipment

Moving Costs

Contingency Costs

Total

Average

$8.55

3.2%

$3.31

1.2%

$4.14

1.5%

$1.44

0.5%

$4.59

1.7%

$170.65

63.3%

$15.86

5.9%

$39.67

14.7%

$2.71

1.0%

$18.56

6.9%

$269.48


In markets where construction costs are greater, like the European markets, New York City and San Francisco, soft costs, such as architecture & engineering fees are also greater. A finding one would expect, given the nature of these markets and the fact that services cost more in these areas.

In most markets, hard costs such as technology costs, project management fees, furniture costs, and move costs are all fairly standard with each market hovering around expected averages -- with a few exceptions.

Furniture & Equipment is higher in San Francisco, New York, and Washington, DC, as well as technology costs, further contributing to the above-average totals seen in these markets. In the APAC markets, particularly Chinese markets, the cost of construction is relatively much lower compared to other markets due to the varying labor and materials costs around the world.

Comparing Construction Costs to Cost of Living

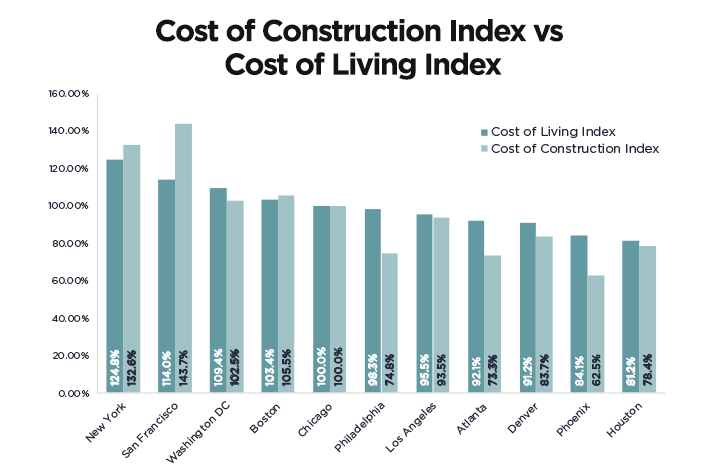
As expected and evidenced, markets with a higher average construction cost are those markets that have a greater cost of living relative to other major markets. We’ve used the Cost of Living Index for US markets and compared it to our gathered Total Construction Costs to create a Cost of Construction Index. For both indices we’ve set Chicago at 100%, as it was a natural mid-point. Both Cost of Living and Cost of Construction data in the chart below are relative to average costs in Chicago.

Image treatment

One would expect the Cost of Construction Index to closely follow the Cost of Living Index, however we’ve found some variance. In markets where the Cost of Living Index (dark blue bar) is much higher than the Cost of Construction Index (light blue bar), like Philadelphia, Atlanta and Phoenix, this would imply that Construction Costs are a better value than markets where the Cost of Construction outpaces the Cost of Living, as in New York, San Francisco, and Boston.

In a future issue of the Legal Tenant, we will compare market tenant improvement allowances to the cost of construction to help law firms understand what their out-of-pocket costs will be in a move or renovation.


Questions? Comments? Topic Suggestions?

Contact us


About the Legal Tenant Practice Group

Learn More